Fundamental Analysis
Sensata Technologies is one of the world’s leading suppliers of sensing, electrical protection, control and power management solutions with operations and business centers in 12 countries. Sensata’s products improve safety, efficiency and comfort for millions of people every day in automotive, appliance, aircraft, industrial, military, heavy vehicle, heating, air-conditioning, data, telecommunications, recreational vehicle and marine applications. For more information, please visit Sensata’s web site at www.sensata.com.


Reasons to buy – Sensata Technologies
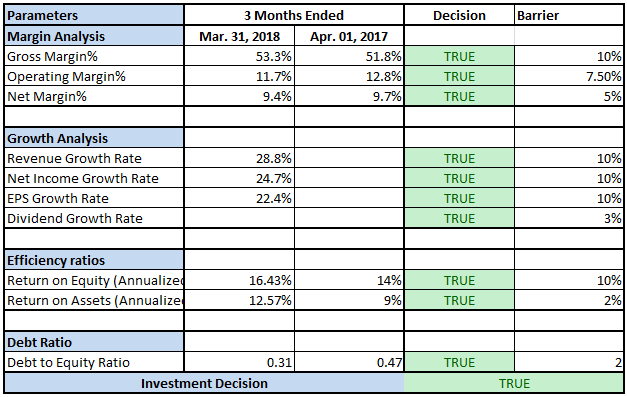
High level decisions on buy or sell for a stock should be driven by
1. The margin that the company makes. i.e. Out of $1 that the company sells how much does the company taken home.
-
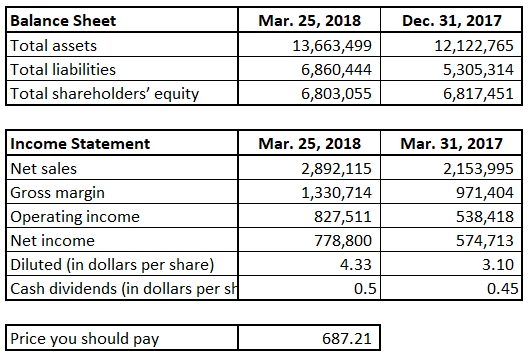
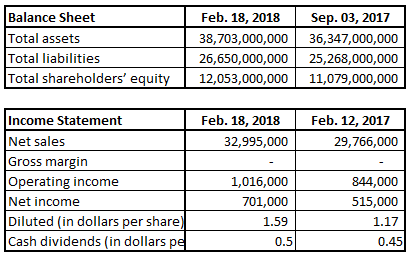
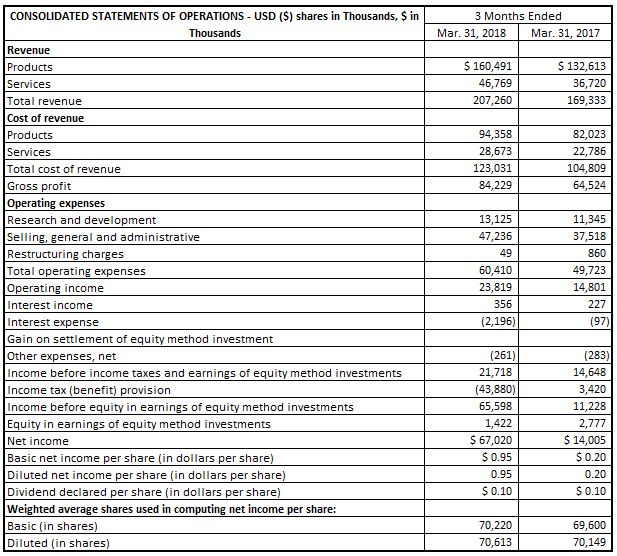
- Here we see Sensata Technologies makes a margin of 16% on Operating Level and about 10% on Net level. This means that out of $1 that it makes $0.21 is being pocketed as profits.
2. The growth rates of the company on revenue, net income, EPS and Dividend. i.e. If it sold $1 last year how much more did it sell this year.
-
- Here we see net revenue growth of 10% in the revenue and the net profit figures grew by 26%.
3. The efficiency ratios of the company on Equity and Assets. i.e. How well is the company able to sweat each $1 that it puts to work in the company.
-
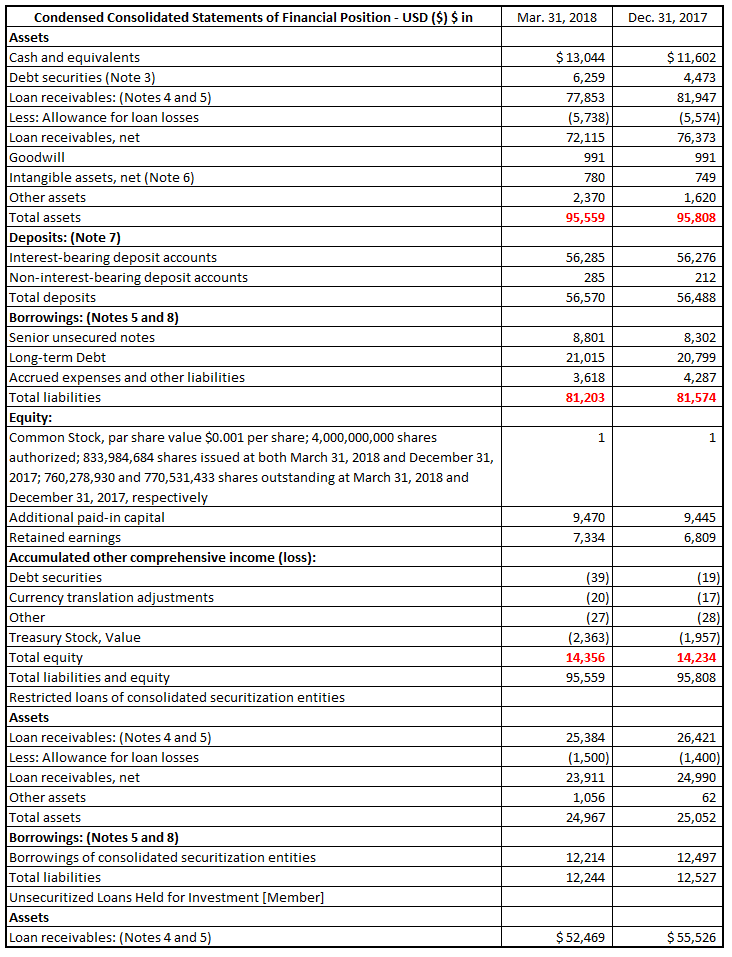
- Here we see Sensata Technologies makes a Return on Assets of 5% and Return of Equity of 15% which is pretty good.
Sensata Technologies supplies sensing, electrical protection, control and power management solutions to a variety of industries. Given the niche space it is in and the profitable manner in which they are able to manage their business, it
GOLD STANDARD : This is one of the no-debate stocks that are a must have in ones portfolio.
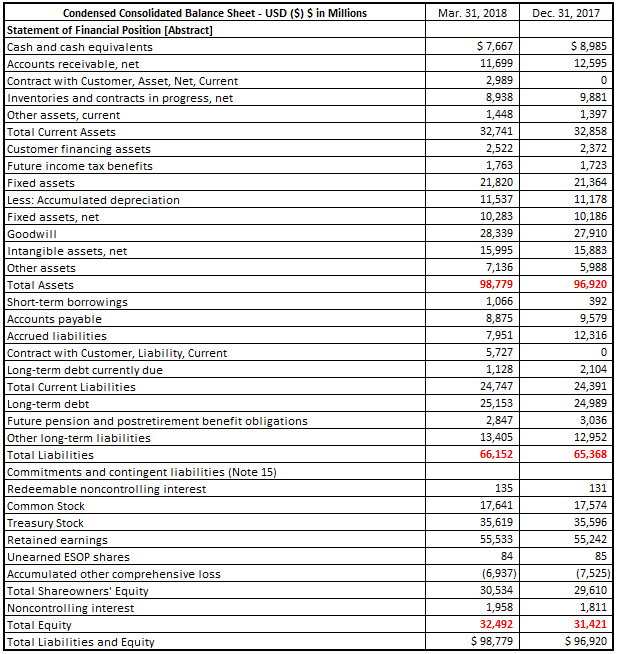
All these ratios can be found in the attached excel sheets and are based on the EDGAR report submitted by Sensata Technologies to the SEC. All the data on the above analysis can be found at the link below
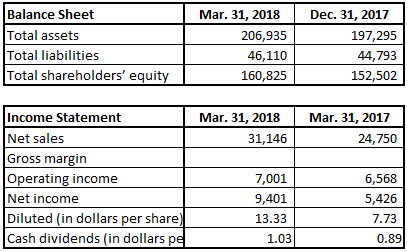
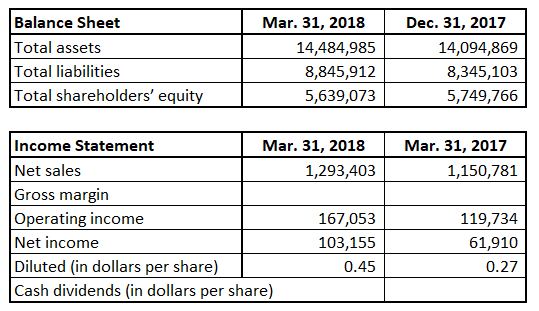
Balance Sheet

Income Statement